Recording experiments about use GDB to debug a core file.
code of file test.c1
2
3
4
5
6
7
8
9
10
11
12
13
14
15
16
17
18
19int actual_calc(int a, int b){
int c;
c=a/b;
return 0;
}
int calc(){
int a;
int b;
a=13;
b=0;
actual_calc(a, b);
return 0;
}
int main(){
calc();
return 0;
}
Executing our script and configuring core dumps
1 | $ gcc -ggdb test.c -o test.out |
-ggdb option to gcc will ensure that the debugging session using GDB; it adds GDB specific debugging information to the test.out binary.
1 | $ man core |
Now we know what is “core dumped”. Thus, let’s see core file:
1 | $ ls |
We can see that this is 64-bit core file, user id is 1000, platform is “x86_64”. Notice: 8 in core filename that it was a signal 8 which terminate the program. Sigal 8 is SIGFPE, means Floating Point Exception.
Using GDB
So try to use GDB to analyze this core dump file1
$ gdb ./test.out ./core.1813.1000.8.test.out.1729779410
Then it displayed as following:1
2
3
4
5
6
7
8
9
10
11
12
13
14
15
16
17
18
19
20
21
22
23
24GNU gdb (Ubuntu 12.1-0ubuntu1~22.04.2) 12.1
Copyright (C) 2022 Free Software Foundation, Inc.
License GPLv3+: GNU GPL version 3 or later <http://gnu.org/licenses/gpl.html>
This is free software: you are free to change and redistribute it.
There is NO WARRANTY, to the extent permitted by law.
Type "show copying" and "show warranty" for details.
This GDB was configured as "x86_64-linux-gnu".
Type "show configuration" for configuration details.
For bug reporting instructions, please see:
<https://www.gnu.org/software/gdb/bugs/>.
Find the GDB manual and other documentation resources online at:
<http://www.gnu.org/software/gdb/documentation/>.
For help, type "help".
Type "apropos word" to search for commands related to "word"...
Reading symbols from ./test.out...
[New LWP 1813]
[Thread debugging using libthread_db enabled]
Using host libthread_db library "/lib/x86_64-linux-gnu/libthread_db.so.1".
Core was generated by `./test.out'.
Program terminated with signal SIGFPE, Arithmetic exception.
#0 0x000056423afe413b in actual_calc (a=13, b=0) at test.c:3
3 c = a / b;
(gdb)
This is the first time that I try to use gdb to analyze a file. Following the output, it shows SIGFPE is an arithmetic exception. Besides, there is the frame called #0 which is the procedure terminated. This frame displays memory address, function (use procedure in tutorial) name, parameter value, and the line number in “test.c”.
Then we can see what is the line of code (line 3), c=a/b, but “b=0”, it is the reason of exception.
Backtracing
And try backtracing, (command bt), it shows as:1
2
3
4(gdb)
#0 0x000056423afe413b in actual_calc (a=13, b=0) at test.c:3
#1 0x000056423afe4171 in calc () at test.c:12
#2 0x000056423afe418a in main () at test.c:17
It is the reverse order of things that happen: frame #0 (the first frame) is the last function which was being executed by the program when it crashed, and frame #2 was the very first frame called when the program was started.
Power user tip: if you use multiple threads, you can use the command thread apply all bt to obtain a backtrace for all threads which were running as the program crashed!
Frame inspection
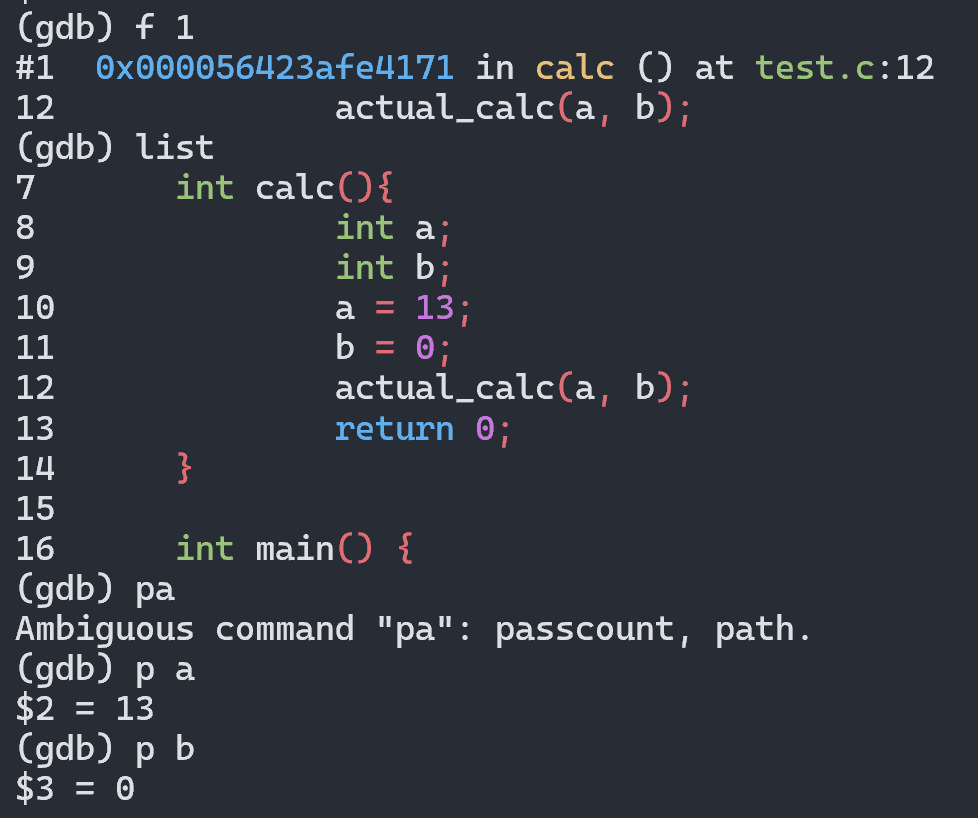
Inspect each frame, the matching source code (if it is available), and each variable step by step:
1 | (gdb) f 2 |
f 2means ‘jump into’ frame 2listto list the source code (Only useful when you have listing source code permission)p ameans print the value of variable “a”
Conclusion
Finish this tutorial, I learned some usage of GDB. It is not too difficult to learn, but my English writing skill is still poor.
Have a nice day!
By Le4f,
2024.10.25